The Spread of Infectious Disease in 19th Century Canada
Purpose and Scope of this Project
As a student of history at Carleton University, my area of interest is in Canadian urban and social history. During my studies I have bacome particularly interested in 19th century Canada and the effects of industrialization and urbanization. While I have had great success in my studies thus far, these successes have been within the traditional methods of the discipline; research and essay writing. As such, this is my very first attempt at a digital history project, and is intended only to be an exploration of the ways in which the methods and tools used by digital historians could be applied to the subject matter of a more traditional history project. In other words, my purpose is to explore the ways in which these methods could supplement, or add an extra layer to, traditional projects I have done in the past dealing with this subject matter. The benefit here is that the analysis of the data collected for this project would be extremely time consuming, if not impossible, in the traditional method.
Being that this is my first attempt at creating such a project, I feel that it is very important to state from the outset that the scope of this project is very limited and, as stated above, experimental. The datasets I am working with are very limited in that they have been collected from only one source, the Canadiana Discovery Portal.
Introduction
Throughout the 19th century, the growth of industry in Canadian cities saw an increase in the urbanization of the population. During this period the percentage of the population moving to reside within major Canadian cities such as Montreal and Toronto significantly outpaced the development of infrastructure (see: Bettina Bradbury, "Pigs, Cows and Boarders: Non-Wage Forms of Survival among Montreal Families, 1861-91," Labour/Le Travail, 14, 1998). This lack of infrastructure, particularly sanitary infrastructure, was the leading cause of the spread of infectious disease and resulted in increased mortality rates, particularly among the young and old, and most prominently in poorer, working-class communities (see: Patricia Thronton and Sherry Olson, "Infant Mortality in Three Cultural Settings in Montreal, 1880." Infant and Child Mortality in the Past, 1997; and: Francois Pelletier, Jacques Legare, and Robert Bourbeau, "Mortality in Quebec during the Nineteenth Century: From the State to the Cities," Population Studies,) 50, 1, 1997).
Method
In this project I will focus on two of arguably the most problematic infectious diseases to plague Canadian cities during the 19th century: cholera and smallpox. In order to track the rise and fall of the severity of the epidemics caused by these diseases, I have assembled datasets from the online archive of the Canadiana Discovery Portal.
To build these datasets I have used an API to extract all documents available in the archive that contain hits on the keywords "cholera" and "smallpox." By considering the dates and cities where the materials collected were published, I was able to create .csv files from which to create various visualizations which I can then use to analyze this data.
Taking a Broad Look at Infectious Disease Across Canada During the 19th Century
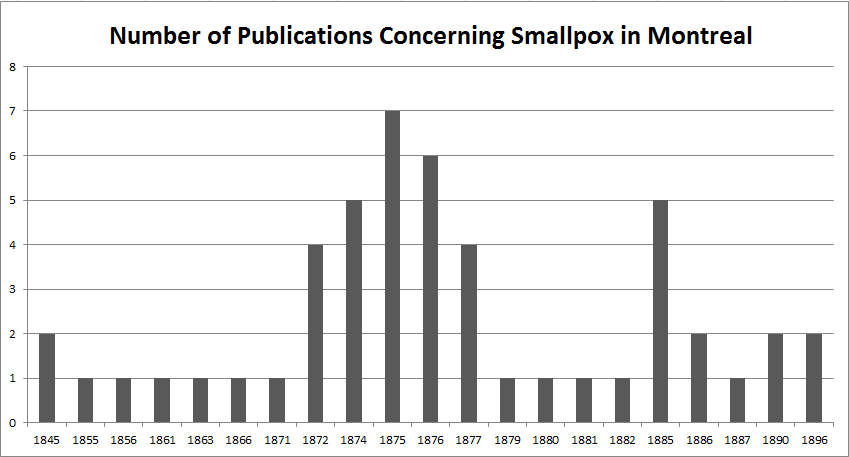
The first interesting way in which I found to visually analyze the data I collected was to consider the frequency with which documents published containing my keywords appear in the digital archive according to date. I have seperated the data into two sets, one for cholera, and one for smallpox. Using bar graphs created with Excel, these were the results:
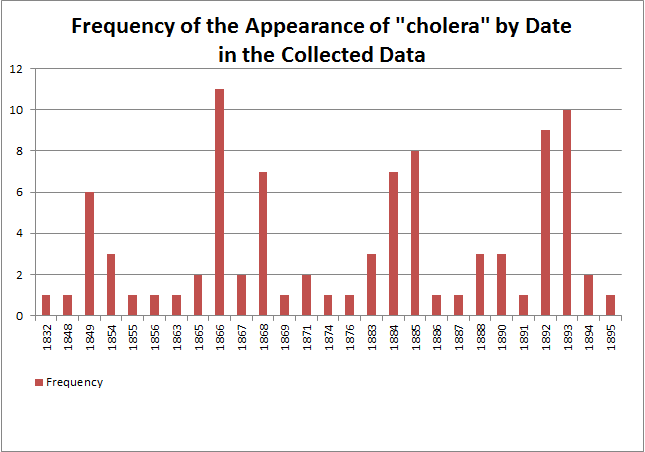
In the above graph concerning cholera, we see a peak in the amount of documents published that mention cholera in 1866. This result is interesting when considering the sheer number of secondary material published concerning the cholera epidemics in Upper and Lower Canada between 1832 and 1866 (see: C. M. Godfrey, "The Cholera Epidemics in Upper Canada 1832-1866, 1968). I found this to be particularly interesting considering the fact that my dataset is so limited in its scope, and yet, seems to produce rather accurate results.
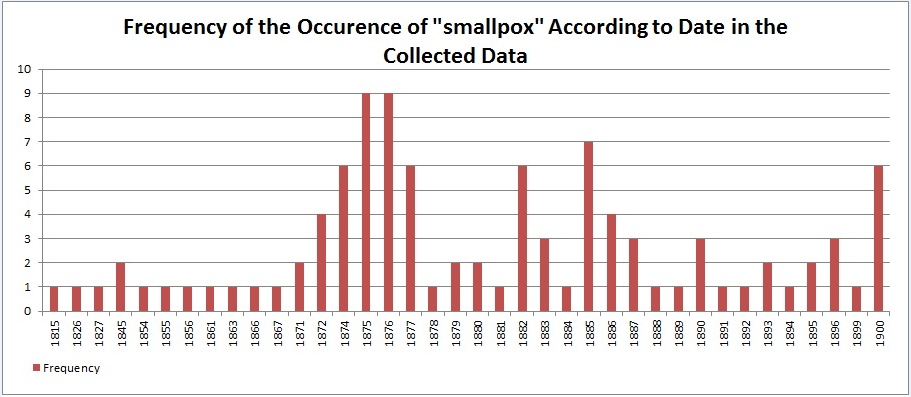
In this bar graph we see the reults for smallpox, with the peek years of the epidemic occurring in 1875 and 1876. What is interesting about this result is that this is at a time when there is a serious debate happening in Montreal concerning the idea of compulsory vaccination. What is even more interesting about this is the fact that the controversy surrounding compulsory vaccination during the ten years between 1875 and 1885 in Montreal actually culminated in a riot that was reported on as far away as New York.
The next step in analyzing this data in a very broad, national context, is to look at the number of documents published containing my keywords according to city. To do this I have used .csv files to create bar graphs like the ones above, as well as using one of the visualization tools available through RAW called an "Aluvial" vector graph.
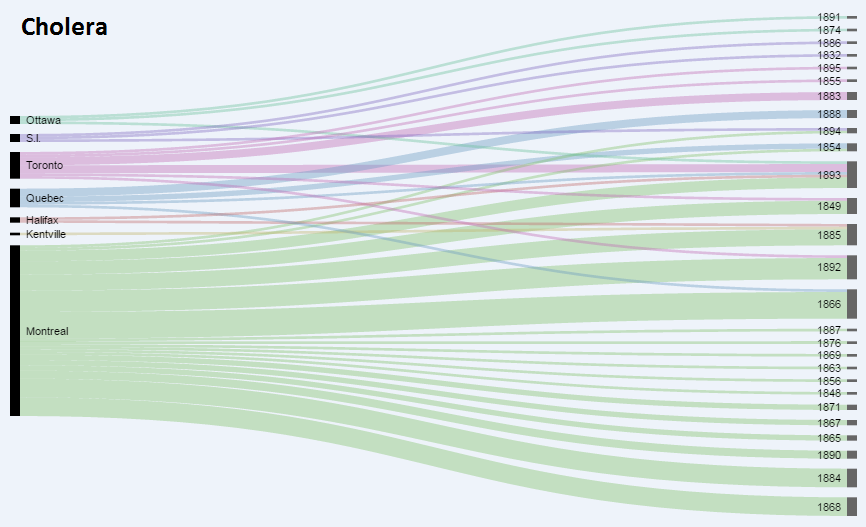
Here we see that Montreal suffers terribly compared to all other Canadian cities according to the number of publications in the archive. What is also interesting here is that we can see the same major spike in 1866 that we saw in the bar graph above. This vector graph also reflects how the spread of cholera to smaller cities like Ottawa happens much later within the timeframe in question. This graph also indicates what one would expect, which is the fact that major port cities like Montreal, Toronto, and Quebec, with large urban populations, are hit the hardest.
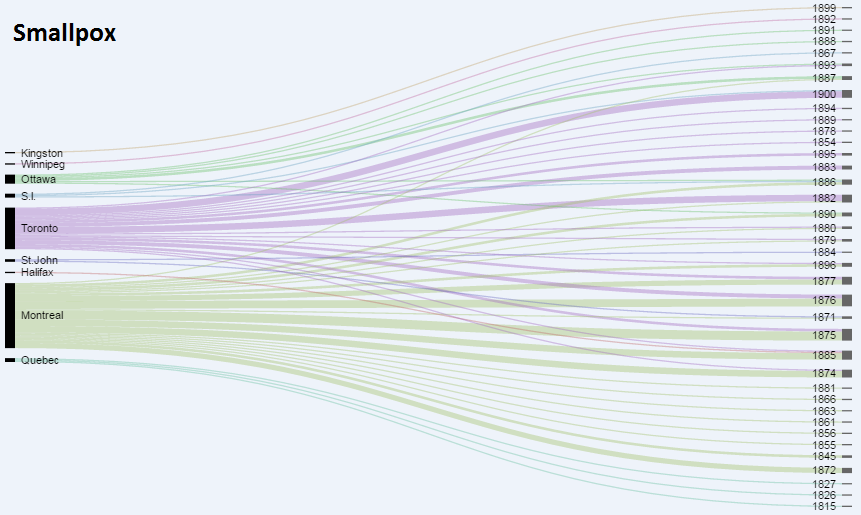
In the above graph concerning smallpox, we can see that, according to the material drawn from the archive, it differs significantly from cholera in that it is far more widespread. We can also see that the smaller city of Ottawa has a larger number of publications in the archive concerning the disease than the larger port city of Quebec. While this result is both interesting and unexpected, it must be kept in mind that this could simply be due to the limits of the collection of the digital archive, and is not necessarily representative of actual fact.
Taking a Closer Look at Infectious Disease in Canada's Major Urban Cities of the Nineteenth Century: Montreal and Toronto
While the above Aluvial graphs give some indication as to the spread of infectious disease per city over time, reading the data in this way from these graphs can be difficult, as the dates are arranged in a rather random order (even though the spreadsheets that these graphs are drawing data from have been organized in ascending order by date). In order to take a closer look at change over time, I have made .csv files contaning data for both Toronto and Montreal from which to construct some frequency charts that give a much clearer visualization.
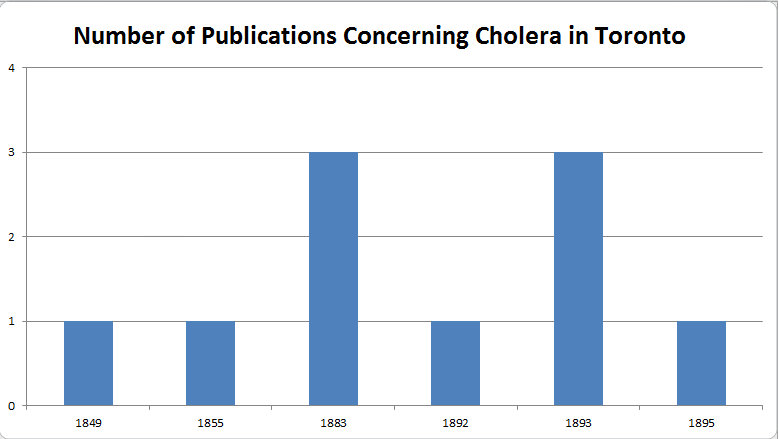
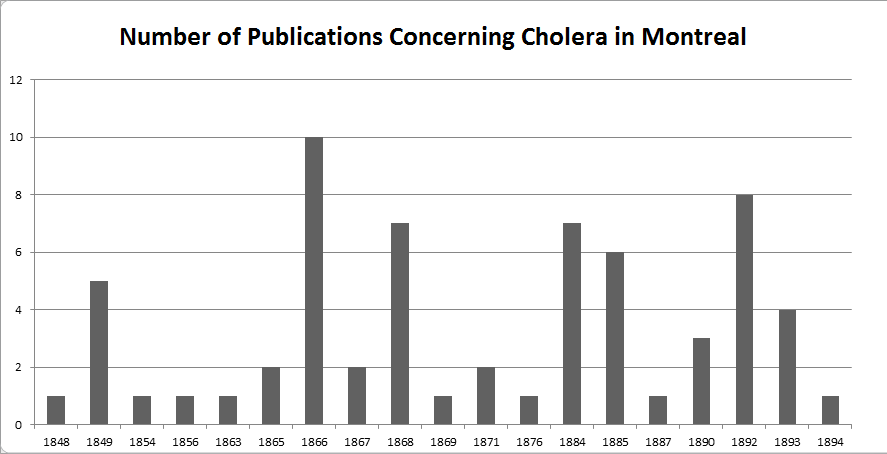
These bar graphs give a much more clear visualization of the fluctations in the number of publications present in the archive concerning cholera by date and city than the above Aluvial graph. As was obvious in the Aluvial graphs above, we see that, according to the archive, cholera was a much bigger issue in Montreal than Toronto, with a broader range of dates and fluctuations.
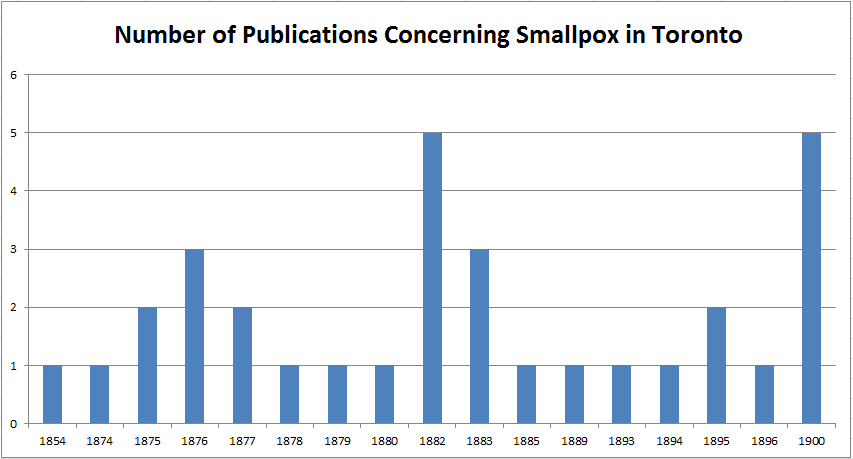
As was the case with the Aluvial graph concerning smallpox, the above bar graphs reflect the more widespread nature of smallpox compared to cholera. Again, these bar graphs serve to provide a much clearer visualization of the fluctuations in the amount of published materials in the archive by date. What we also see in the bar graph for Montreal is the large fluctuations in the amount of material published during the decade of the compulsory vaccination debate between 1875 and 1885, with a significant spike in 1885, the year of the riots.
Taking a Broad Survey of the Content of the Published Material
While I have found that analyzing the data collected from the digital archive by date and city to be an interesting way to approach my topic, there is still the matter of all of the content within the published documents collected. To read through all of this content in order to get a sense of what was being written concerning cholera and smallpox would take an extraordinary amount of time. But, by using an open source piece of software called Overview we can get a very broad sense of the subject matter rather quickly.
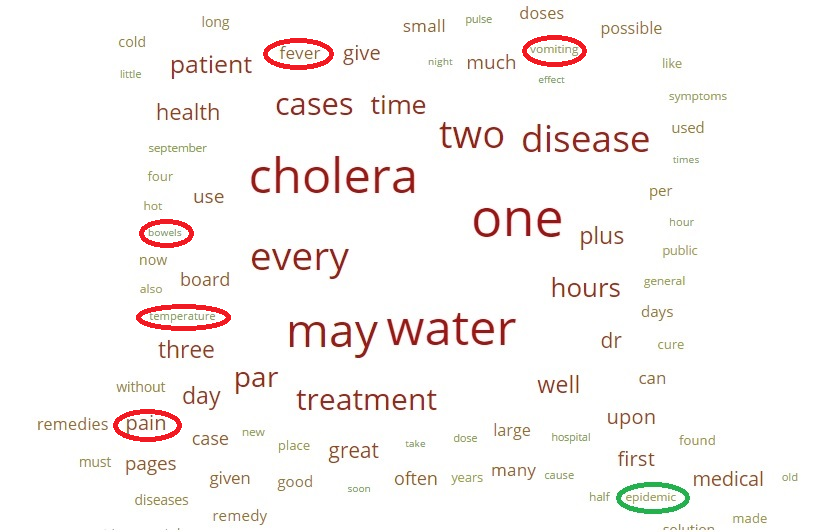
In the above Word Cloud graphic generated by Overview, we get a general idea of what words are occurring most frequently in the publications collected from the archive concerning cholera. For example, we can see that water is mentioned quite frequently. This is exactly what one would hope to see, as cholera has the attribute of being most widely transmitted by contaminated water supplies. What is also represented here are the symptoms of cholera which is an infection of the intestine that, as the graphic indicates, causes pain, fever and vomiting. Also important to note is the relative frequency of the appearance of the word "epidemic," which points to the widespread nature of the disease, particularly, as mentioned above, between 1832 and 1866.
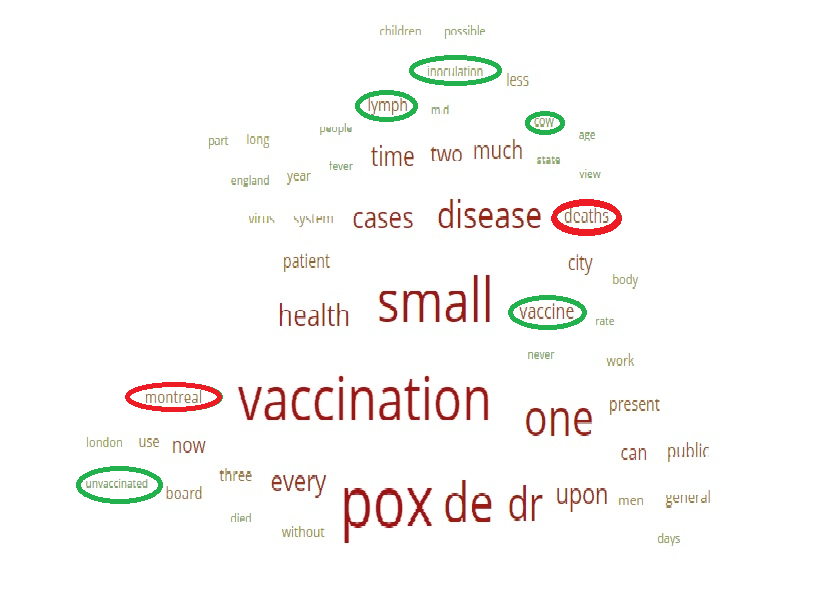
In the same Word Cloud graphic generated for the materials published concerning smallpox, we again get a fairly accurate view, according to what would be expected, of what topics most frequently accompany literature dealing with this disease. As expected, the frequency of the appearance of the words "Montreal" and "deaths" is reflected here and is representative of the high mortality rates in Montreal caused by the epidemic. This could also be understood to reflect what has been indicated by the above graphs, which is the fact that Montreal is the city most heavily afflicted. Also, as expected, vaccination and any associated terms appear quite frequently.
The ferquency of the presence of the words "lymph" and "cow" may be a bit of a surprise to those unfamiliar with the particualrs of the compulsory vaccination debate in mid-nineteenth century Montreal. Certainly, it was an unexpected and welcome surprise for me. This is because smallpox vaccines in the 19th century were made from the secretions of cow lymph of animals infected with cow pox (and apparently, to some extent, still is). Where this fits into the compulsory vaccination debate is in the fact that, in 19th century vaccines, the quality of the vaccine was very important in terms of its effectiveness. Citizens of lower class often had to be vaccinated at cheap clinics that often operated much like high-volume production lines when vaccination became mandatory in Montreal, where the quality of the vaccine would be questionable. Compare this to methods of vaccination within the upper classes, who would visit their own, trusted, family physicians. The outbreak of the compuslory vaccination riots in Montreal in 1885 can be attributed to this as well as the fact that not being vaccinated made one subject to fines and would often cost working-class people their jobs, as employers perceived those who had not been vaccinated as being at high risk of infecting those around them (for more details on this see: Jennifer E. Keelan, "Biopolitics and the Body Politic: Anti-Vaccinationism in Canada from a Historical Perspective," Comparative Program on Health and Society: University of Toronto, 2006).
Conclusion
While this project was meant to be one of an experimental and exploratory nature, I feel as though it was a success in its ultimate goal of being a means to supplement more traditional research on a more traditional historical topic.
Using some of the basic tools and methods applied by digital historians to collect and visually analyze large sets of data, this project was far more successful in accurately reflecting the scope and content of published materials concerning infectious disease in 19th century Canada than I had expected. That is, by collecting, formatting, and graphing the publications available through the Canadiana Discovery Portal's online archive, I have been able to get a sense of the spread and severity of the cholera and smallpox epidemics on a scale that would be extremely time-consuming if not impossible by using traditional methods.
What is most surprising to me through this experimental digital history project is the general level of accuracy achieved through the collection and visualization of this data according to my own traditional research. While being concerned that collecting data from only one online archive might not produce the expected results, the final product was quite the opposite. Graphing the occurence of the available publications by date and city produced an accurate picture of the time periods when the respective edpidemics were at their peak, while also accurately presenting which Canadian cities suffered the most.
Topic modeling the content of the available publications with Overview has also produced suprisingly accurate results. Such issues as the symptoms of cholera and the issue of its spread through contaminated water were clearly present in the Word Cloud graphics. Similarly, the debate surrounding compulsory smallpox vaccination and mortality rates in 19th century Montreal were also effectively represented in the topic model, which also alluded to some of the more complex issues that led to the 1885 riots.
Overall, this exploratory experiment in the methods of digital history has served to broaden the methods whith which I will conduct historical research in future projects, with the ultimate result being the ability to incoporate the tools and techniques used here to add an extra layer of depth and scope to future projects.
Resources
The datasets I compiled and worked with can be found below:
Complete cholera dataset
Complete smallpox dataset
Cholera CSV files containing cities and dates
Smallpox CSV files containing cities and dates
Or download them directly form my Github repo
The online archive:
Visualization and other tools:
19th century Montreal newspaper collection: